
No Code Data Analytics

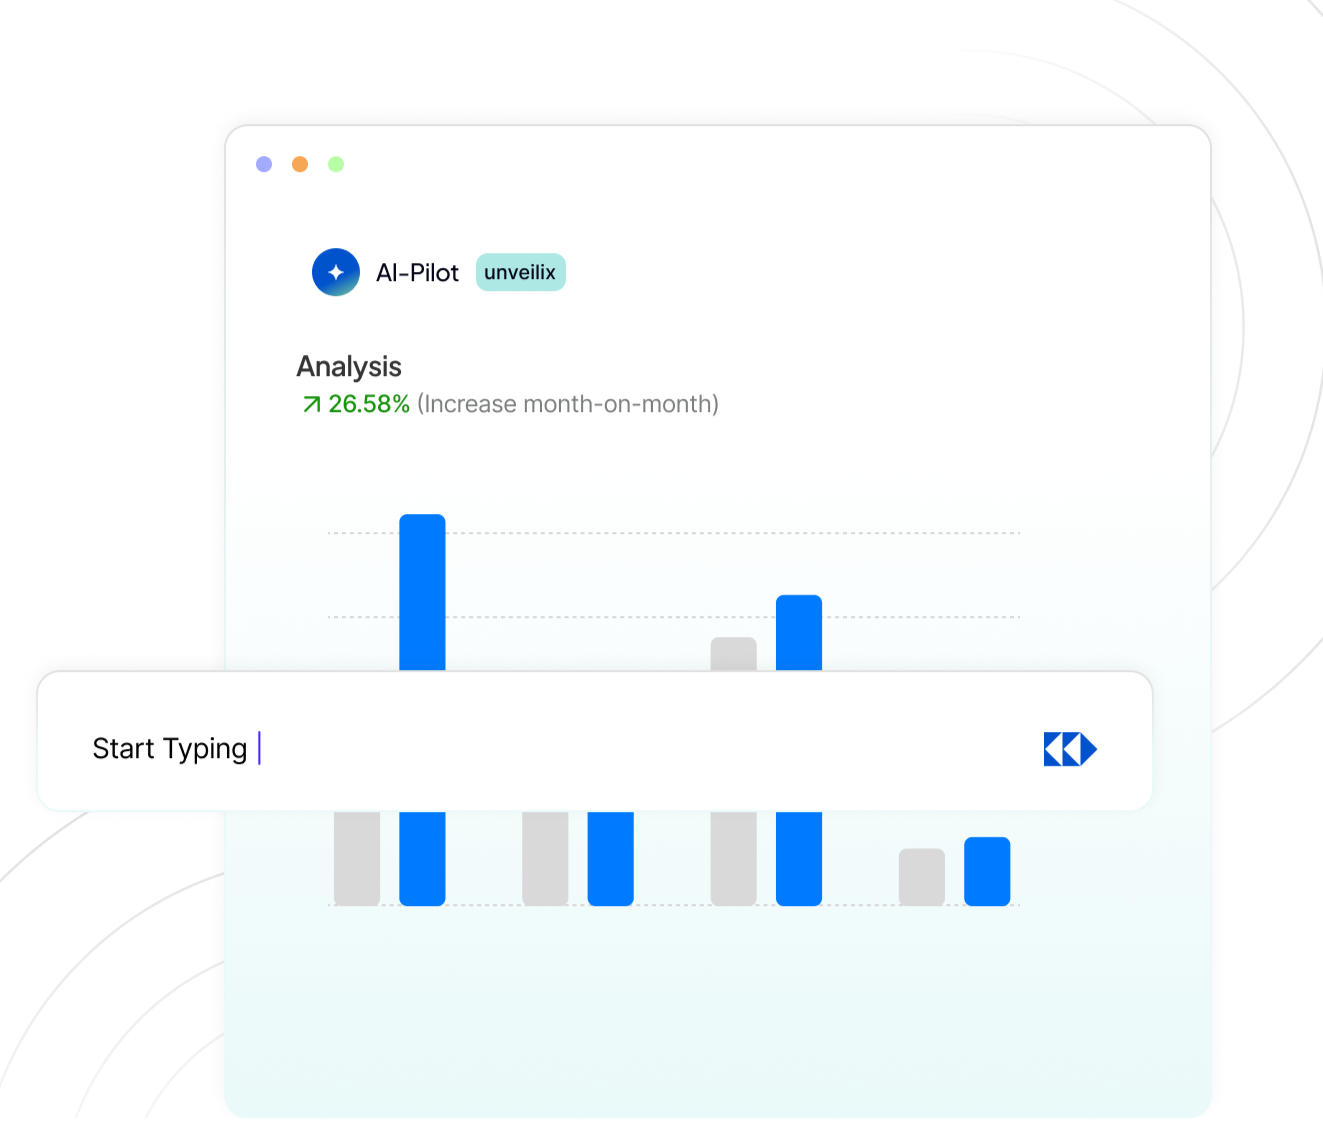
Advanced Al insights

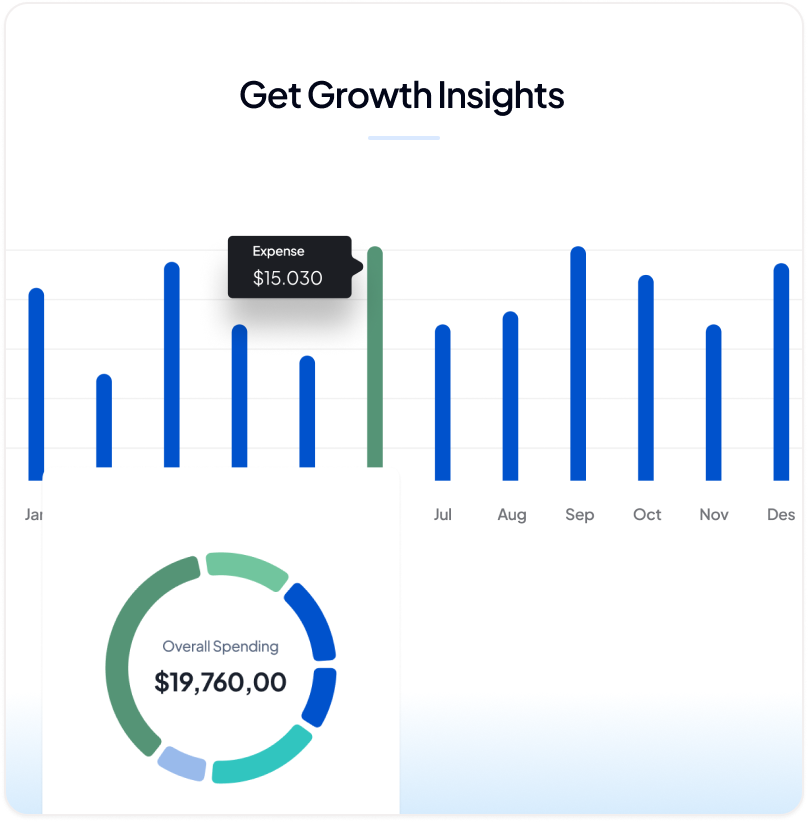
Al-driven data analyst with growth insights.
What is Unveilix?
Built for teams that want answers, not dashboards. From questions to decisions, in seconds.
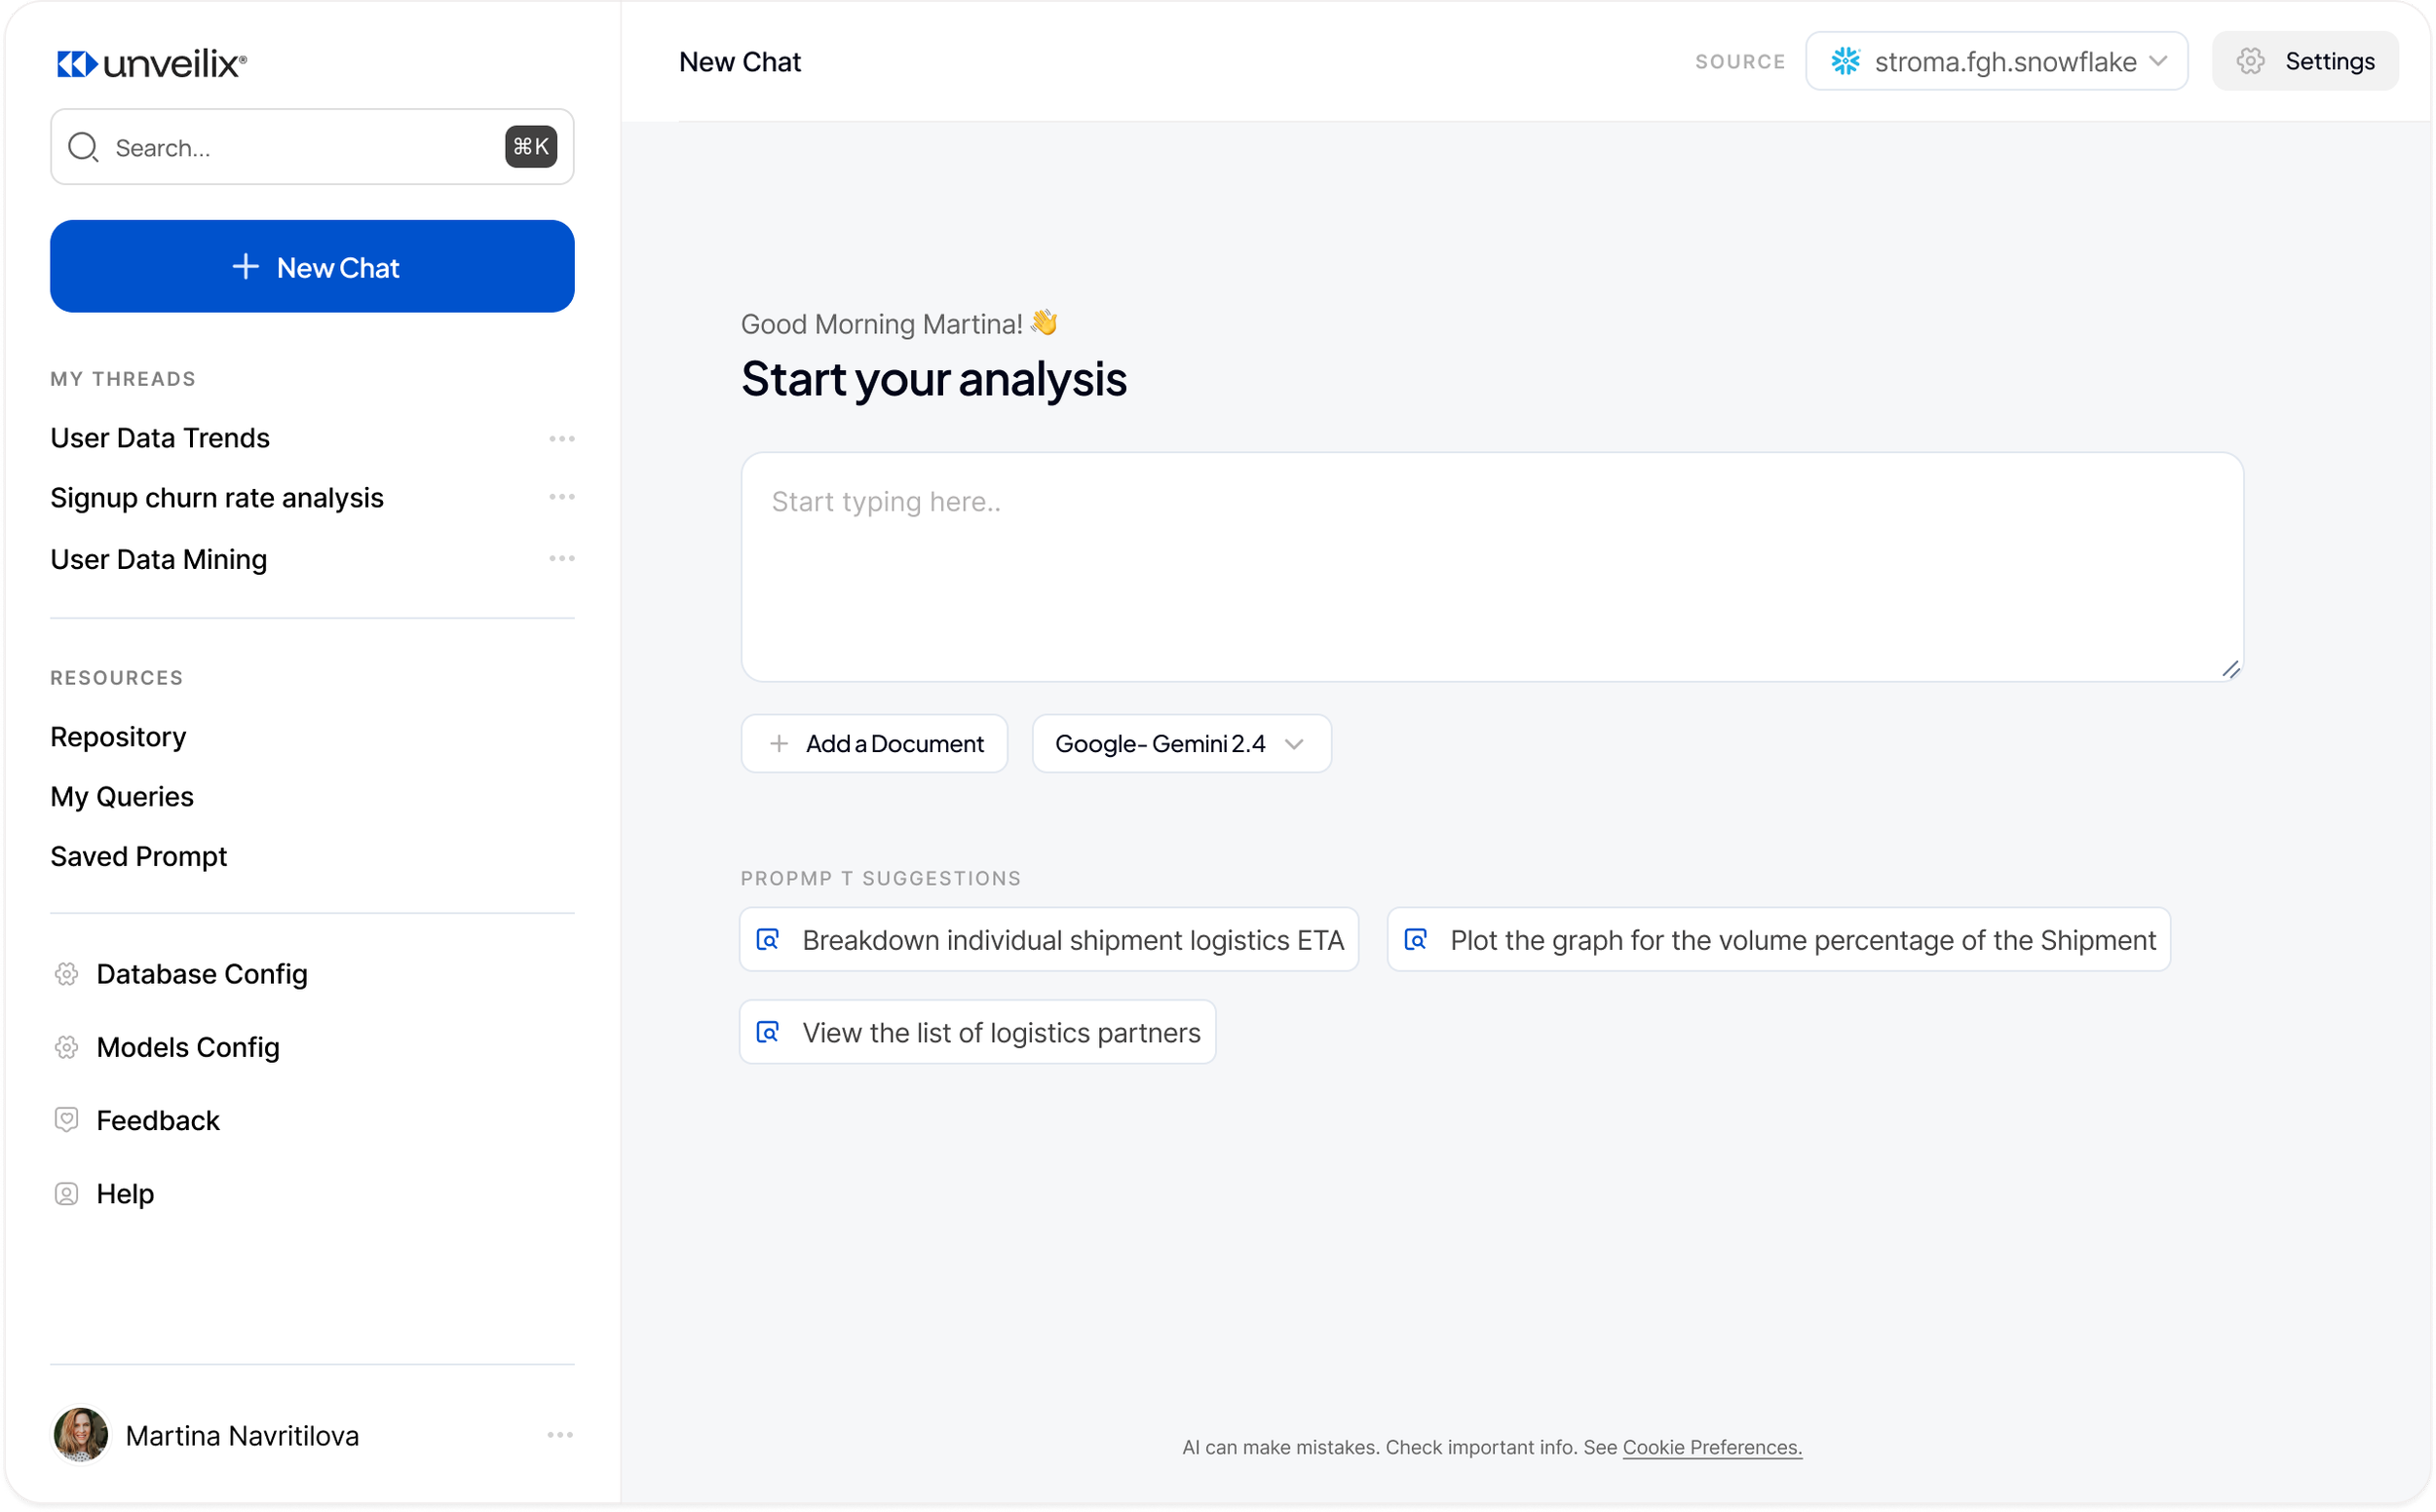
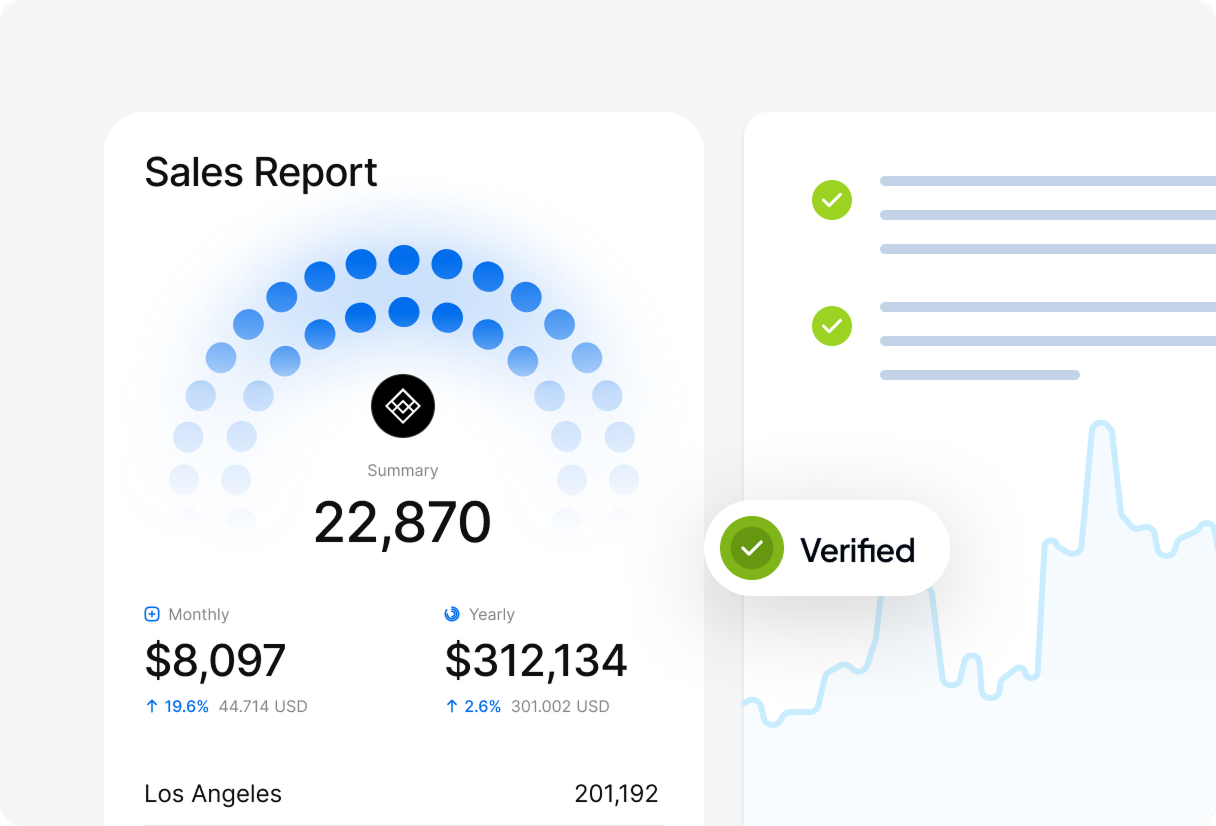
An AI-driven analyst that turns natural language into insights across all your databases with detailed explanations, not just data.
Unveilix helps you get smart insights from your existing data. Uncover product insights you knew didn't exist.
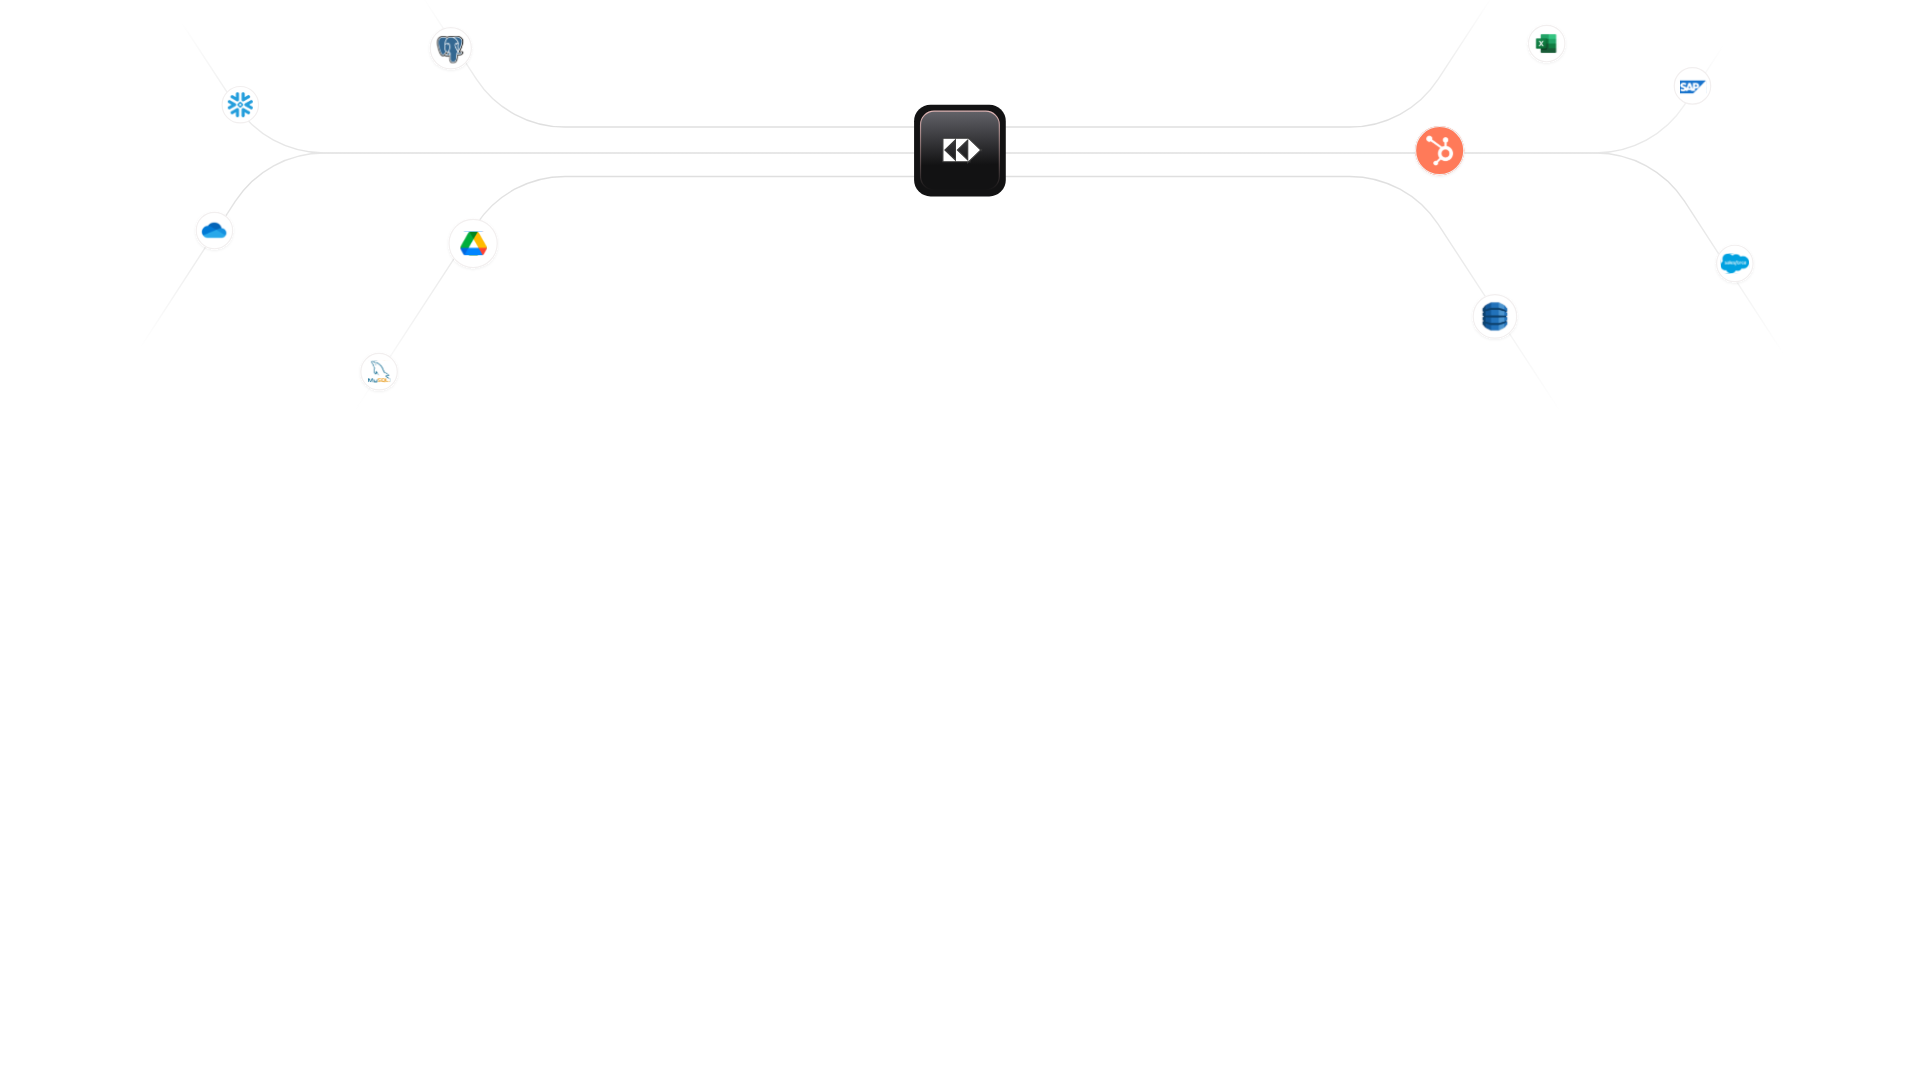
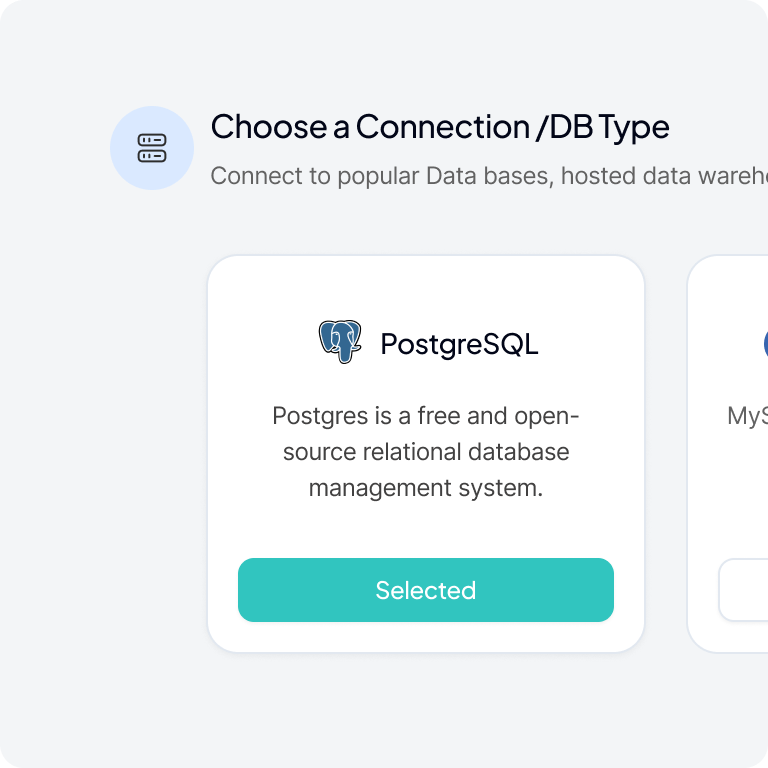
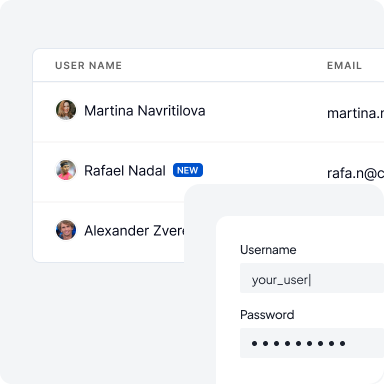
Integrate into Your Stack
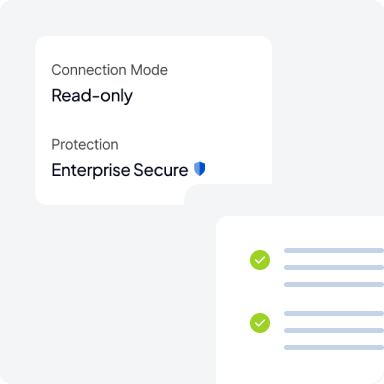
With enterprise-grade security, Unveilix is fully equipped to safeguard all your data with secure, layered data connections and retrievals.
Secure Workflows
Discuss analytics, findings, queries, manage how your team generates insights, and track progress all within your workspaces.
Collaborate with Ease
Start analysis within minutes.
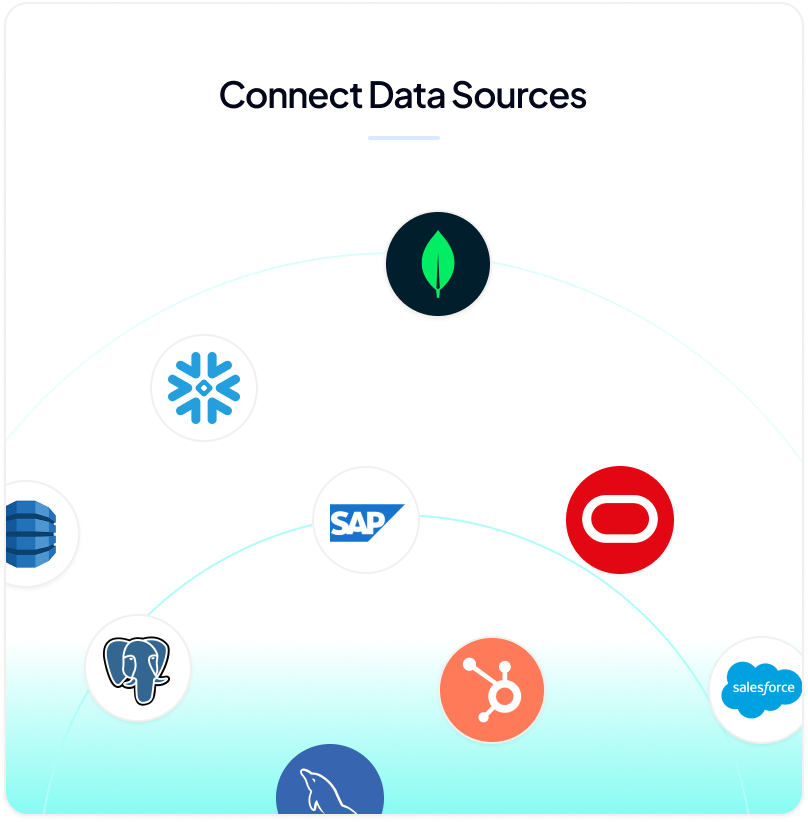
Built for modern day workflows. Instantly connect your data sources!
Reduce the time in doing Manual data analysis. We turn raw data into real-time business insights - instantly.
With Unveilix
Designed for speed, clarity, and action teams.
unlock insights that drive growth.
Explore data like modern teams: Conversational, Contextual, and Continuous.
Employee an analytical powerhouse built for decision-makers who want clear answers fast - without becoming data pros.
Remove the friction and ask your data anything. Get insights in seconds without setting up dashboards.
Without Unveilix
Taking too long to tidy up dashboards & code-heavy ways makes analysis unproductive.
Complex data dashboards require weeks to set up and demand a data engineer.
Needs more training effort because data analysis is built for technical teams.
Manual data arranging needs a long time because of the static dashboards and the code-first complexity.
Why Use Unveilix
Easy setup. Simple questions. Rapid Insights.
Unlock Growth

Your data has the answers. We help you hear them with smart prompts, contextual suggestions, and deeper drill-downs powered by AI.
Hassle Free Integration

Built for decision-makers who want clear answers fast from across your CRM, product, and finance data.
Designed for Data Consumers
No queries, no dashboards, just smart answers from your connected tools.
Turn your whole company into data users. No onboarding guide needed. If you can ask a question, you can get an answer.
Get in Touch
We'd love to hear from you! Whether you're curious about features, need onboarding assistance, or just want to say hi, we're here.
From blockers to decision, all with an idea and a single prompt.
Traditional analytics tools ask you to think like a data scientist. We flip it, the tool thinks for you.